von Thimo Hofner
Google Ads Performance Max campaigns offer a comprehensive way to combine different ad formats and channels to get the most out of your advertising budget. But to unlock the full potential of these campaigns, it’s important to properly analyze and understand the data and results, and not just rely on Google.
In this post, I’ll show you how to drill down into the performance of your Performance Max campaigns to make important decisions. Let’s get started.
By the way, if you want you can also check out my Video on this:
Also, check out my Performance Max campaign guide for more in-depth information about the campaign type.
First, it is important to get an idea of how the PMax campaign is currently performing. The best way to do this is to look directly at the graphs in the Campaign Overview.
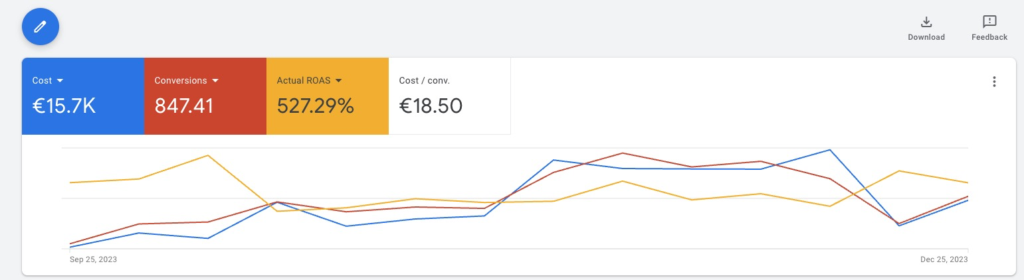
Select the metrics you want to explore correlations between.
How do conversions change as costs increase or decrease? How does ROAS (return on ad spend) change over time? Is the budget being fully utilized?
You can answer all these questions right from the dashboard.
Of course, the most important metrics are the hard facts:
Costs: How much of your budget have you spent?
Conversions: How many sales or leads did you generate?
Costs/Conversion: How much does a conversion cost you on average?
ROAS or Conv. Value/Cost: How much turnover do you generate for every euro invested?
There are also other metrics that are frequently considered:
Impressions: How many times your ads were shown?
Clicks: How often were your ads clicked on?
CTR (click-through rate): When your ads are served, how many people click on them?
Avg. CPC (cost per click): How much a click costs you on average?
Important: When looking at the performance data of your campaigns, the time period is often very important. Before making any decisions, you should make sure that these are not just minor fluctuations. It is best to always look at a longer period of at least 30 days and also look at the long-term development of the campaign.
Also, note that it can often take 3-10 days for a conversion to be attributed to a click. For this reason, the performance of the last few days often looks worse than it actually is.
By the way: This article is mainly about how you can evaluate the campaigns. If you want to learn more about the specific optimization steps, you should take a look at this post: Optimizing PMax campaigns.
Asset groups are used to subdivide your campaign in a meaningful way. With different ad copy, images, videos and possibly products in combination with the audience signals, you can pursue different approaches in a campaign.
In Google Ads, you can view and compare the performance of the individual asset groups.
To access the asset group reports, open your Performance Max campaign and navigate to Asset groups in the left-hand menu. By default, you will see the summary view. To see more detailed data, switch from the summary to the table view.
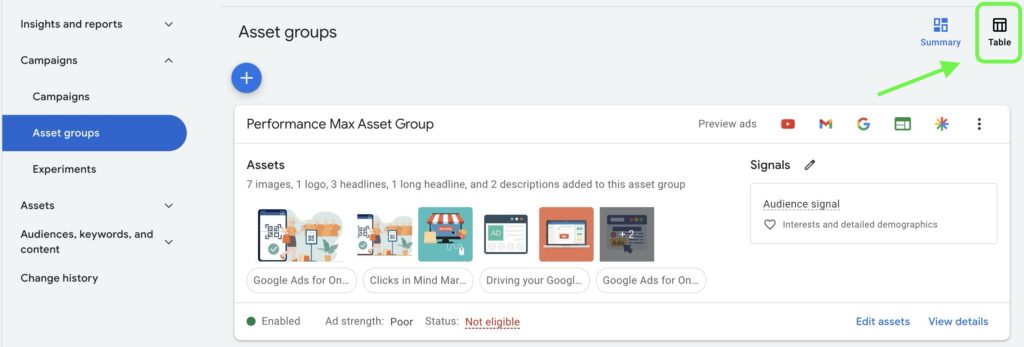
This way, all asset groups are displayed in rows one below the other.
By default, the table view does not show data on clicks, conversions, or other metrics. However, you can easily change this by customizing the columns.
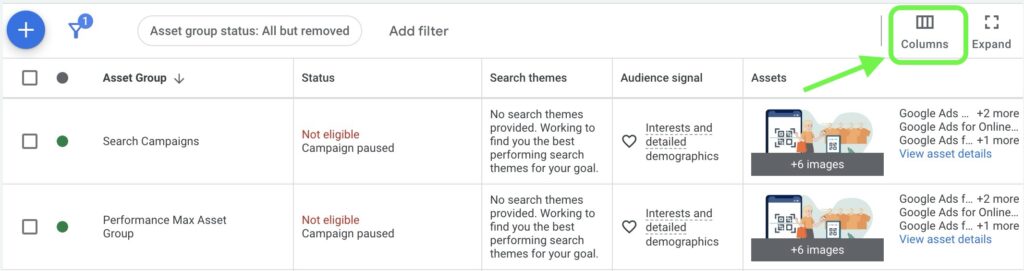
To do so, click the column icon and select the metrics that are relevant to your analysis.
Once you have selected the desired metrics, you will get a detailed overview of the performance of your asset groups. Pay particular attention to the following aspects:
Top-performing groups: Identify the asset groups with the best conversion data. These groups provide valuable insights into which content and target groups are performing well. You should also make sure that most of the budget is allocated to these groups.
Asset groups with high costs and poor performance: Sort your asset groups in descending order of cost to see if your budget is being spent correctly.
Potential for improvement: Identify the asset groups that are not generating many impressions and see if you can optimize or pause them.
Automated or not, Performance Max campaigns are ultimately about presenting text, display or video ads to users. Whether users click on them or not is primarily influenced by your ad assets – the text, images and videos you can store in each asset group.
Once the campaign has collected enough data, each asset receives a performance-based rating from Google.
To analyze the performance of individual assets, open your Performance Max campaign and navigate to the asset groups. Click on a specific asset group and select “View details”.

This will take you to a report showing the performance of each individual asset. In the performance column you will find a categorization of the assets.

Google rates the performance of the assets in the following categories:
Best: The asset performs best compared to the others. It is also possible that many or almost all assets are classified as “Best”.
Good: The asset performs adequately, but there are better ones.
Low : The asset performs poorly compared to other assets of the same type in the asset group
You may also find the following values:
Pending: In this case, Google does not yet have enough data to evaluate an asset. Unfortunately, there is no exact information on how long it takes for this to happen, as there are various factors involved.
For comparison: For Responsive Search Ads, approx. 2000 impressions are required for a rating.
Not enough data: This value can also appear if no evaluation can be carried out yet. This may also be due to the fact that there are too few assets for a comparison. If in doubt, it is better to add more assets.
Not Applicable: Not all assets can be rated. This applies to HTML5, automatically generated or rejected assets.
Assets that are rated as “Low” should be replaced with new and optimized content. Assets with a “Good” or “Best” rating provide valuable insights into which content works well and can serve as a template for future optimizations.
Use the asset combination report to identify the best combinations of your ad assets. This report shows which combinations perform best and helps you understand how the different elements work together.
For a more detailed guide to analyzing asset performance, read my detailed article Analyzing PMax Asset Performance.
Once your campaign has collected enough data, you will find valuable information in Google Ads under Insights about the signals that the Google algorithm detected during the PMax learning phase.
Perhaps the most important report is the one on search categories or search terms. You will usually find this as the third or fourth segment in Insights:
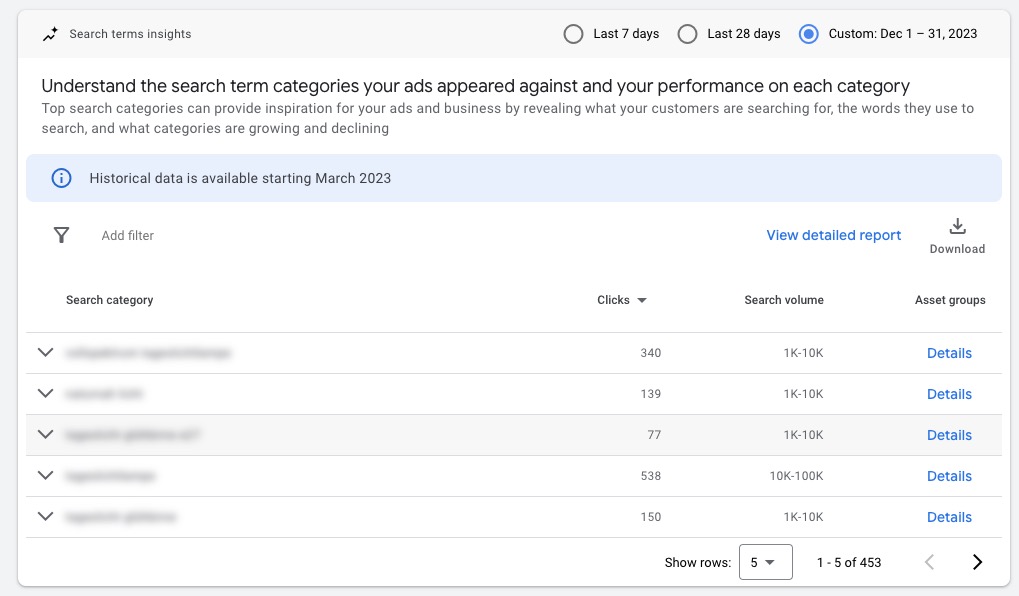
Here you can quickly and easily see which types of search queries have generated the most impressions, clicks, conversions or sales.
In addition to the first view, Google gives you various options for analyzing the search terms in greater depth:
Further subdivision of the search categories:
By clicking on the arrow to the left of each search category, you will find a more detailed breakdown and the specific search terms.
Export data:
You also have the option of exporting the entire data so that you can examine it further in Google Sheets, for example.
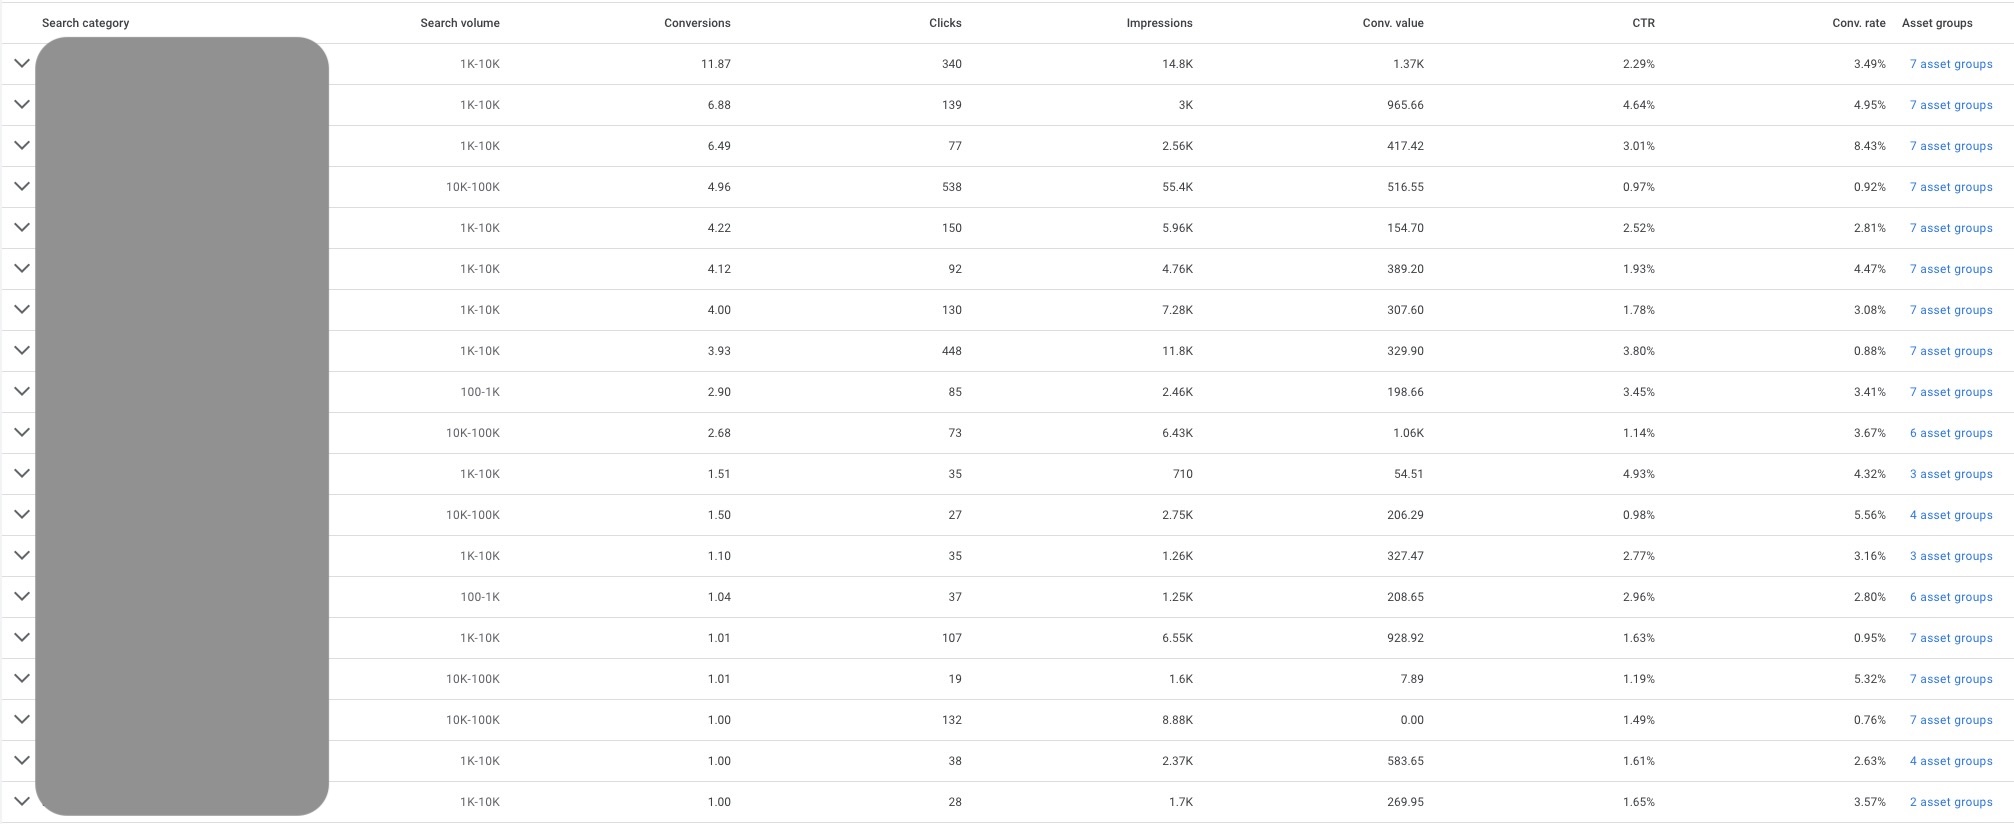
Switch to the detailed report:
Use the blue link to the left of the download to get an even more detailed view in full size, where you can set your columns as usual:
Unlike with search campaigns, you cannot directly control the keywords and search terms in Performance Max campaigns.
You can only use the ad assets, the audience signals with the search themes, the landing pages and, of course, the product feed to give the algorithm an indication of which search queries are relevant for your ads.
The Google algorithm then uses this information to identify the search categories that deliver the best performance.
This is sometimes very interesting, but other times it can also go in the wrong direction. Therefore, check the search categories for the following points:
Brand terms
Performance Max campaigns are opportunistic. They will always take the easiest way to maximize performance. This is why you will often find your brand name among the search categories.
Brand searches naturally promise a much higher probability of conversion. In most cases, however, this is not in your interest.
You should therefore always check the search categories for search queries that contain your brand. My clear recommendation in this case is to exclude your brand in the campaign settings.
You can find out more here: Exclude brand keywords from PMax campaigns
Unknown terms that work well
Check whether there are search terms that have already generated conversions but weren’t on your radar. These are of course valuable insights. Include them as keywords to your account and add them to the campaign as search themes.
Irrelevant terms
If you see a lot of terms that are not performing well and are not really relevant to your offer, this is an indication that Google is receiving the wrong signals. In this case, review your campaign setup.

If your campaign has already collected enough data, you will find the audiences that have generated a disproportionately high number of impressions, clicks or conversions in the insights section.
In many cases, Google is focusing on completely different audiences than the ones you defined with your audience signals.
Audience signals are indications that you give Google to optimize the targeting of your ads.
You can find more details on this in my article Performance Max audience signals.
Navigate to the Insights section in your campaign. You can usually find the audience insights by scrolling to the buttom.
First of all, it is of course interesting to see which audiences the Google algorithm has identified as working well. There are often some that you might not have thought of directly.
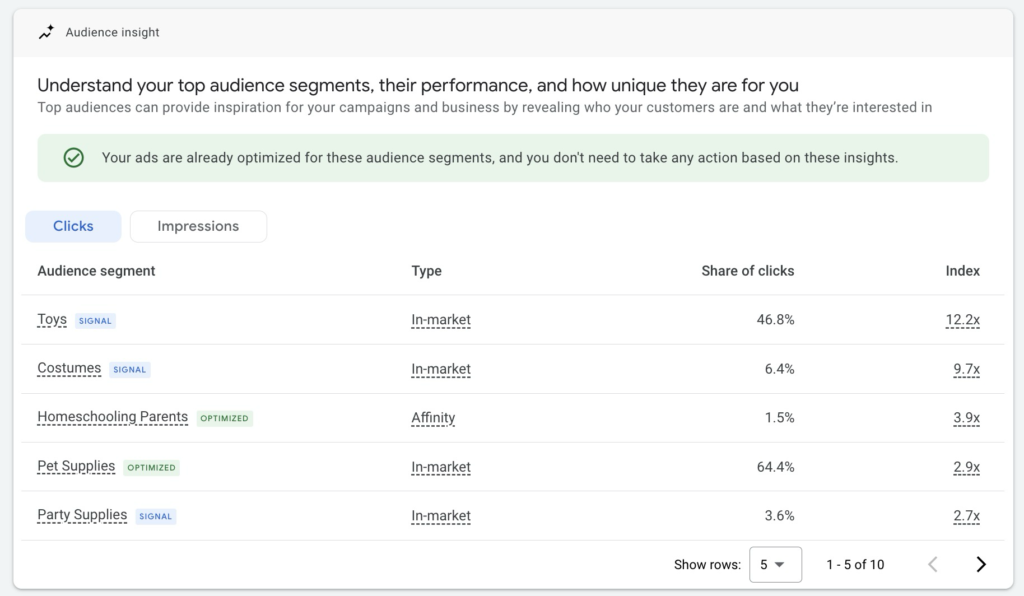
In this analysis, you should look for audience segments that are working well but have not yet been added to the campaign as a signal. You can tell if this is the case by the color next to the audience:
If you find new audiences in your report that work particularly well, you should add them to the campaign as an audience signal. This increases the chance that the algorithm will focus even more on high-performing target groups.
You may also want to look at the audience report for other campaigns. For example, you could add them to your search campaigns as watch groups to see if they are overperforming there as well.
In addition to analyzing your audiences and search categories, it is also important to know who you are competing against in Google Ads. The auction report offers valuable insights into the competitive environment and allows you to compare your presence in search or Shopping results to that of your competitors.
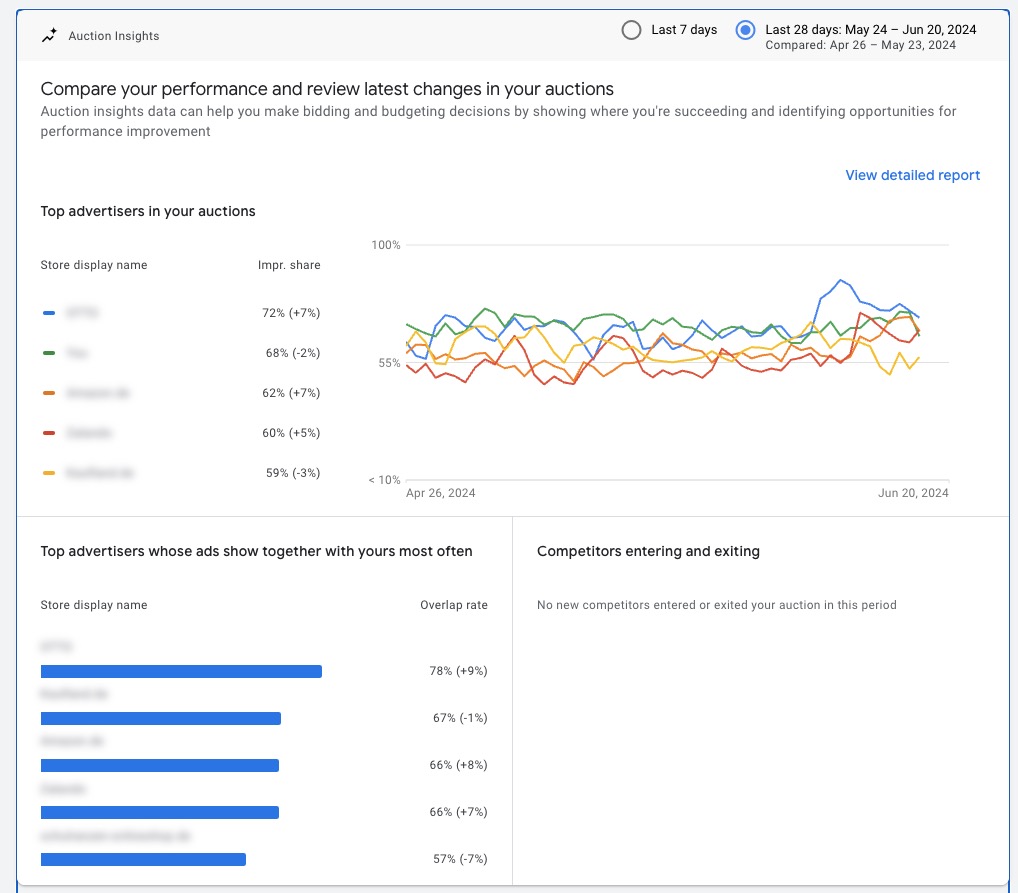
In this report, you can set specific date ranges to see how your share of search impressions changes over specific time periods. This is particularly important as adjustments to your assets can affect the relevance of your ads for key search queries.
With auction statistics, you’ll gain a better understanding of your competition and can adjust your ads, bidding strategies and budgets accordingly to maximize the performance of your campaigns.
Important: This report might not be available for campaigns with a smaller budget. Google only shows it when the search impression share exceeds 10%.
PMax campaigns have become particularly popular in e-commerce. They are the evolution of Smart Shopping campaigns, which no longer exist since 2022.
In most cases, when a product feed is added to a PMax campaign, it will primarily serve Shopping Ads
Since shopping ads basically just use the data from the product feed, you can only influence the ads to a limited extent.
However, with a well-maintained feed and a sensible division into product groups via the listing groups, the quality and relevance of the ads can be controlled.
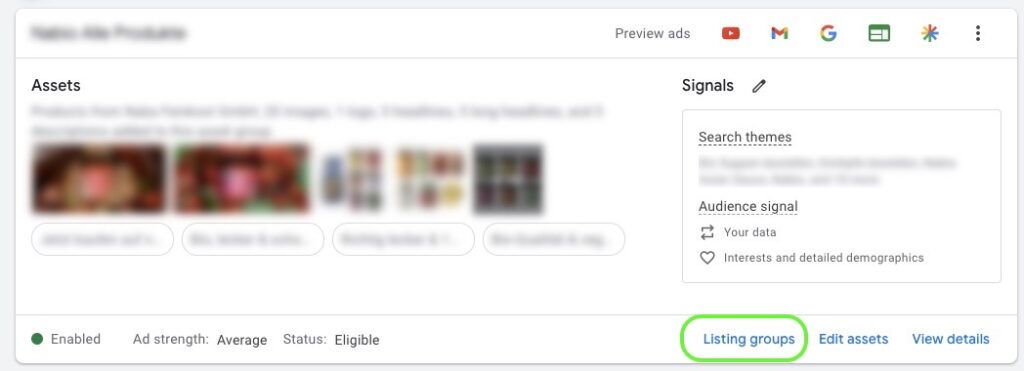
You can use listing groups to select the products or product groups to be advertised for each asset group.
In Google Ads, you can analyze the performance of the associated listing groups for each asset group.
To do this, simply navigate to the asset group overview and click on “Listing groups” to open the report:
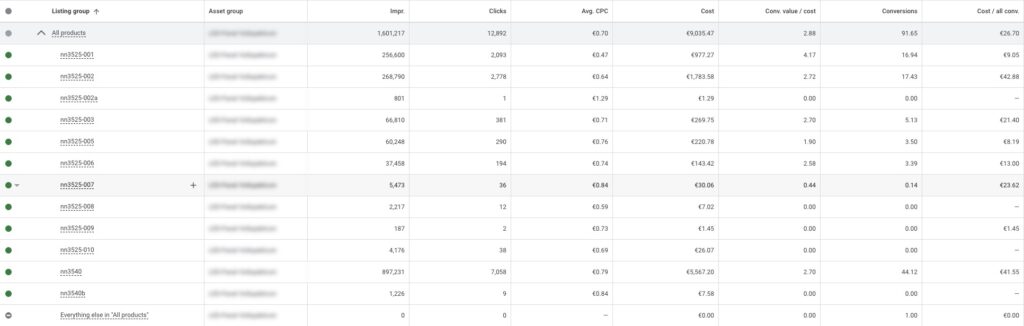
In the listing group view, you can then analyze the data for the individual products or product groups in a table view as usual.
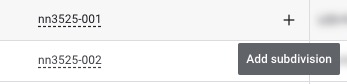
Tip: If you have not used the product IDs directly for the listing groups, but an attribute such as brand, category or product type, you can subdivide each row even further.
To do this, simply hover over an entry with the mouse and click on the plus sign.
The listing groups only give you an impression of the performance within the individual asset groups.
If you want to evaluate how individual products or product groups are performing across campaigns or even across accounts, you can do this via the product reports in Google Ads or directly in the Google Merchant Center.
You can easily find the product reports under Campaigns in the left sidebar. There you can view the performance of products, categories, brands, product types and custom labels.
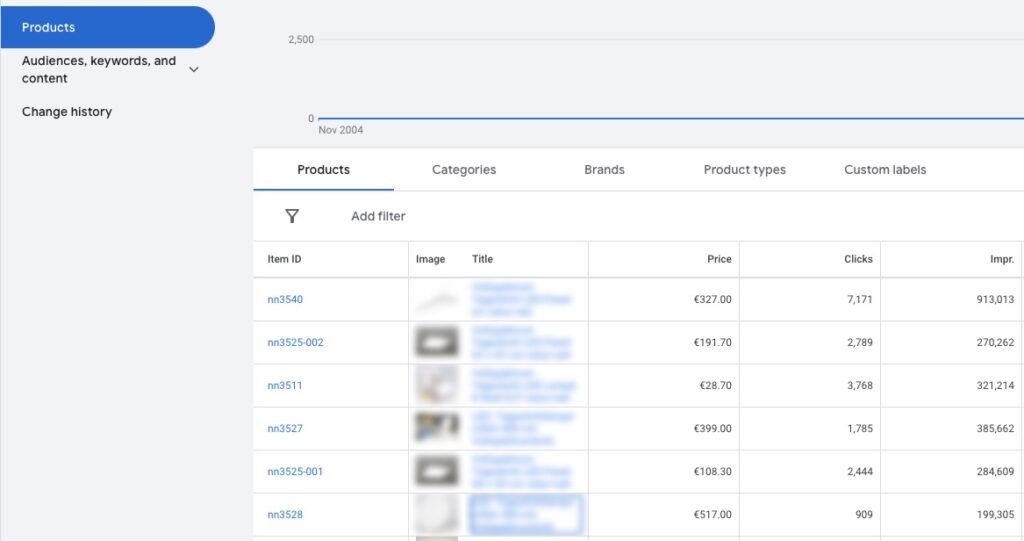
There is also a tab for diagnostics. Status messages and product problems are displayed there.
In addition to the reports you can find directly in Google Ads, I want to show you 3 more options that are more hidden. These require you to either create a custom report or use a script.
Since they run across the entire Google network, Performance Max campaigns often make you wonder where the ads are actually shown.
There is actually a report for this under the menu item “When and where ads showed?”. Only this does not show you any data.
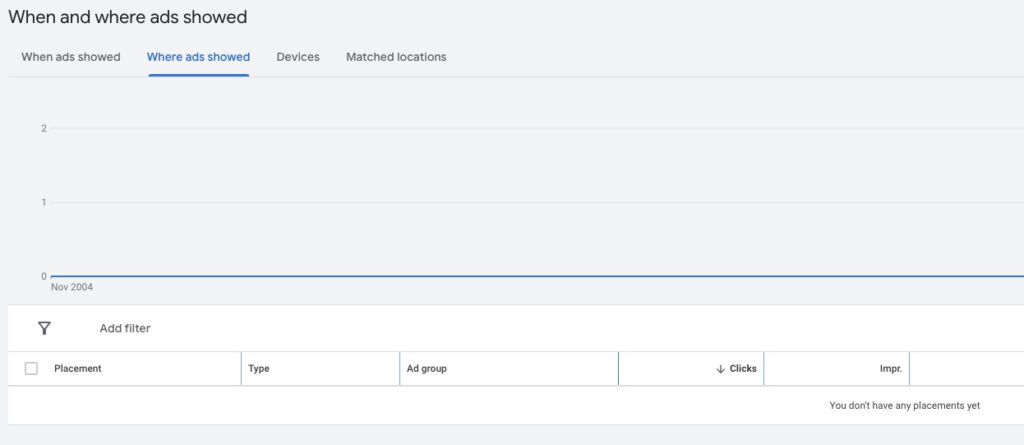
However, there is a way to view the placements of your campaign: Custom Reports.
There is even a template available for this:
Simply navigate to the report editor
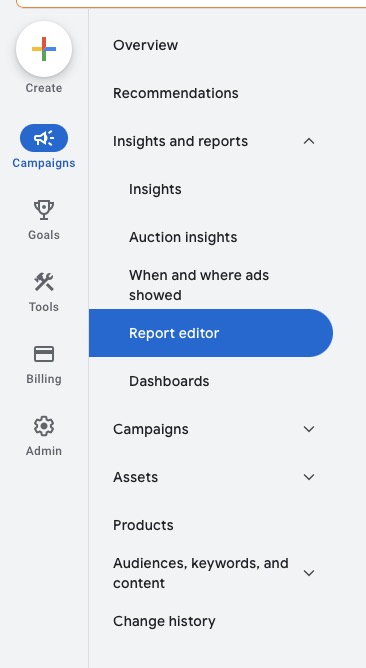
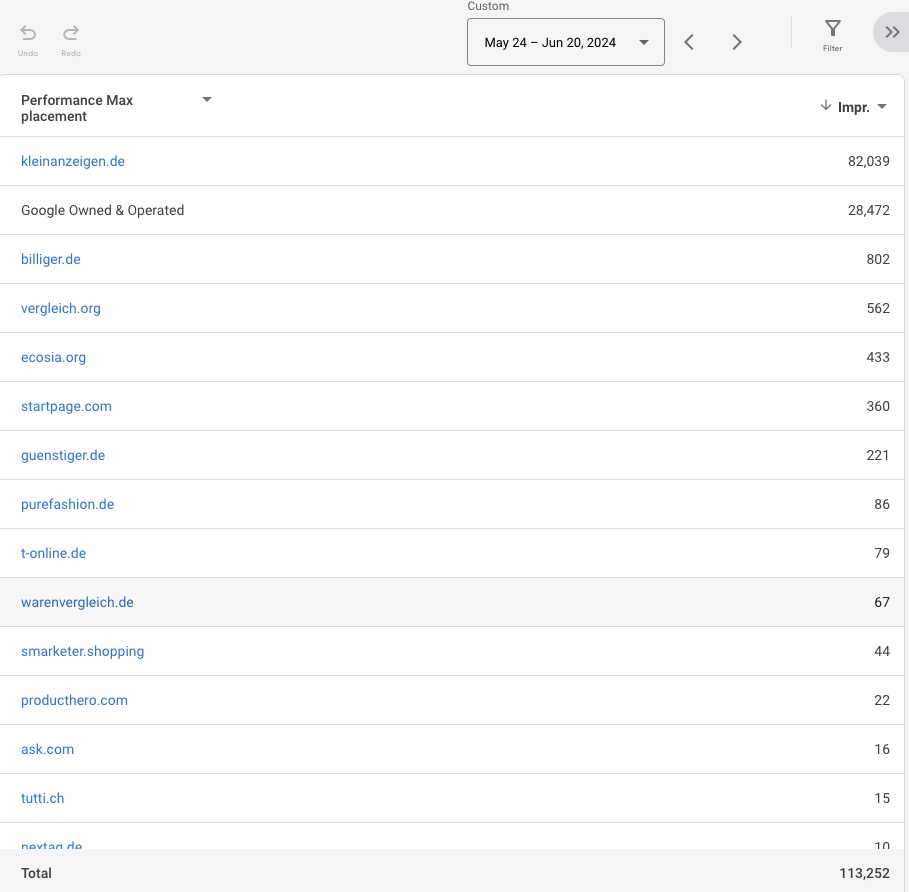
If you scroll down a little, you should find the report preset “Performance Max campaigns placement”.
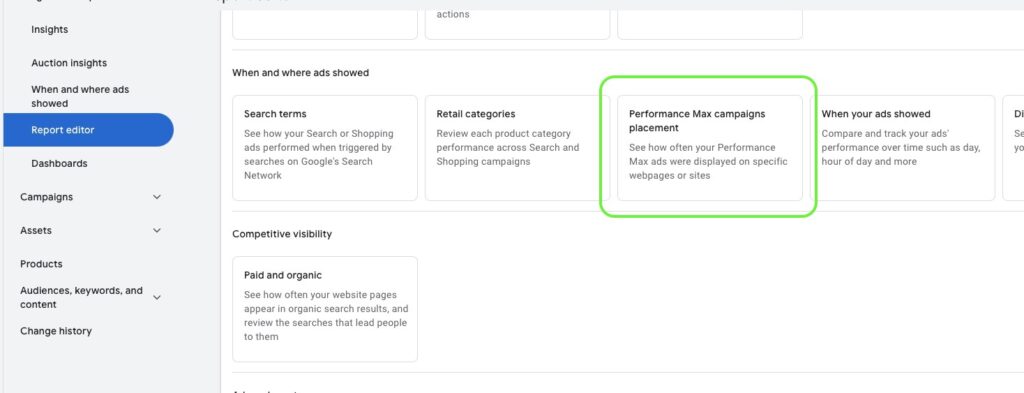
If you click on it, you will get an overview of your ad impressions on other websites. In this case, this mainly is relevant for display ads.
The reporting functions for PMax campaigns are constantly evolving. While it was initially only possible to analyze landing pages via Google Analytics, you can now create a custom report in Google Ads.

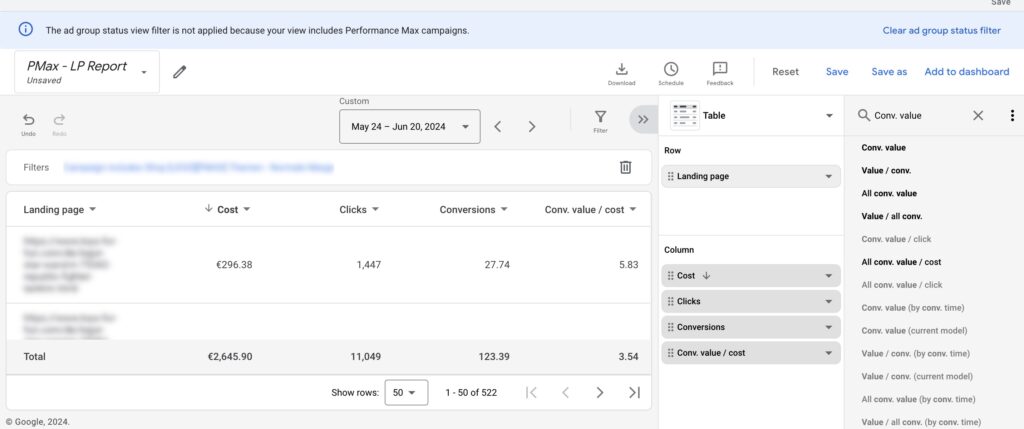
Tip: If you identify pages that are causing problems, you can exclude them from your Performance Max campaign. Use the data obtained to identify problematic pages and add them to the landing page exclusions in the campaign settings.
Performance Max (PMax) campaigns can seem like a black box, as it’s often unclear which Google network is generating the most impressions. Fortunately, there are tools that can help create more transparency: Google Ads scripts.
Scripts in Google Ads are small JavaScript programs that enable the automation of routine tasks and can perform in-depth analyses in your Google Ads account. They can be programmed to extract specific data, create reports or even make automated adjustments to your campaign.
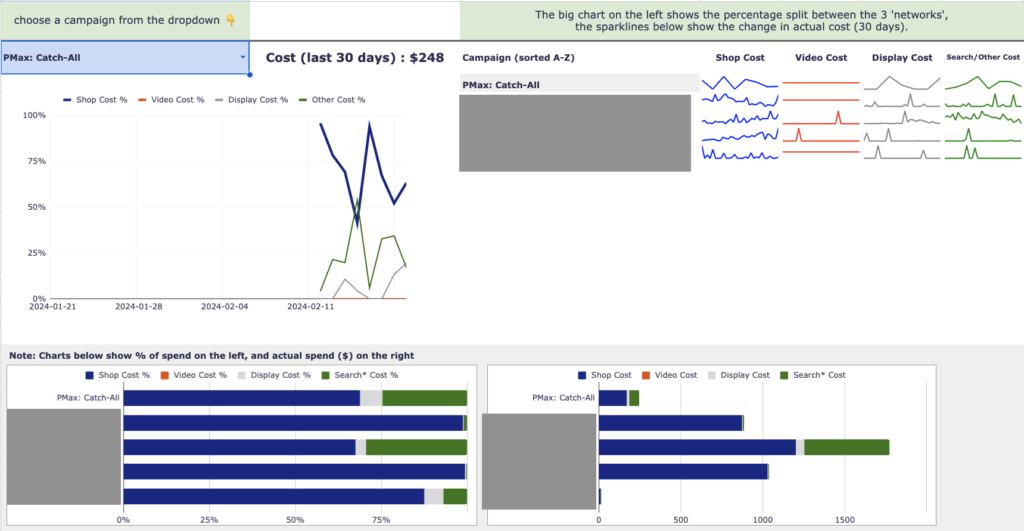
A useful tool for PMax campaigns is Mike Rhodes’ script, which can be found on GitHub. This script generates an automatically updated report in Google Sheets that provides valuable insights into your PMax campaign:
By using this script, you’ll gain valuable insights into your PMax campaigns that can help you make better informed decisions and adjust your advertising strategy accordingly.
Info: Mike Rhodes updates the script regularly. It is therefore always worth checking back to see if there is a new version. There is also a paid version. It offers even more data and looks even prettier.
Here is the link.
While Performance Max campaigns may seem like a black box at first glance, they offer a wealth of valuable data that can help you better understand how they work.
If you know where and how to search, you can gain detailed insights into audiences, search categories, competitors, landing pages and more.
This information is critical to optimize your campaigns and getting the best results possible. Use the reports and insights available to get the most out of your Performance Max campaigns.
I hope this article has been helpful and I wish you the best of luck with your campaigns!
Work smart with Clicks in Mind

Hi, my name is Thimo Hofner. I have been working in online marketing as a Google Ads Manager for more than 5 years. Through many courses, trainings and most importantly working with many different clients, I have learned the best strategies for success with Google Ads. On my blog and YouTube, I share my knowledge to help you drive more success with online marketing.
Driving Your Success Through Smart Online Marketing.
As a reliable partner, I can help your company generate more customers and sales with Google Ads. After more than 5 years as a Google Ads Manager and more than $1.2 million in managed advertising budgets, I can quickly recognize where you need to make adjustments to get more out of your budget.

© 2026 Clicks in Mind