von Thimo Hofner
Google Analytics 4 (GA4) offers many functions for analyzing Google Ads data. However, by default, it is often not enough to gain deeper insights. You either have to create your own reports or customize existing ones. In this article, I’ll show you how to integrate Google Ads reports into GA4 and why it’s important to understand the limitations imposed by data protection measures.
How to create and edit Google Ads reports in GA4:
Link Google Ads:
Connect your Google Ads account to GA4 (Admin > Product Links > Google Ads) to get all relevant data.
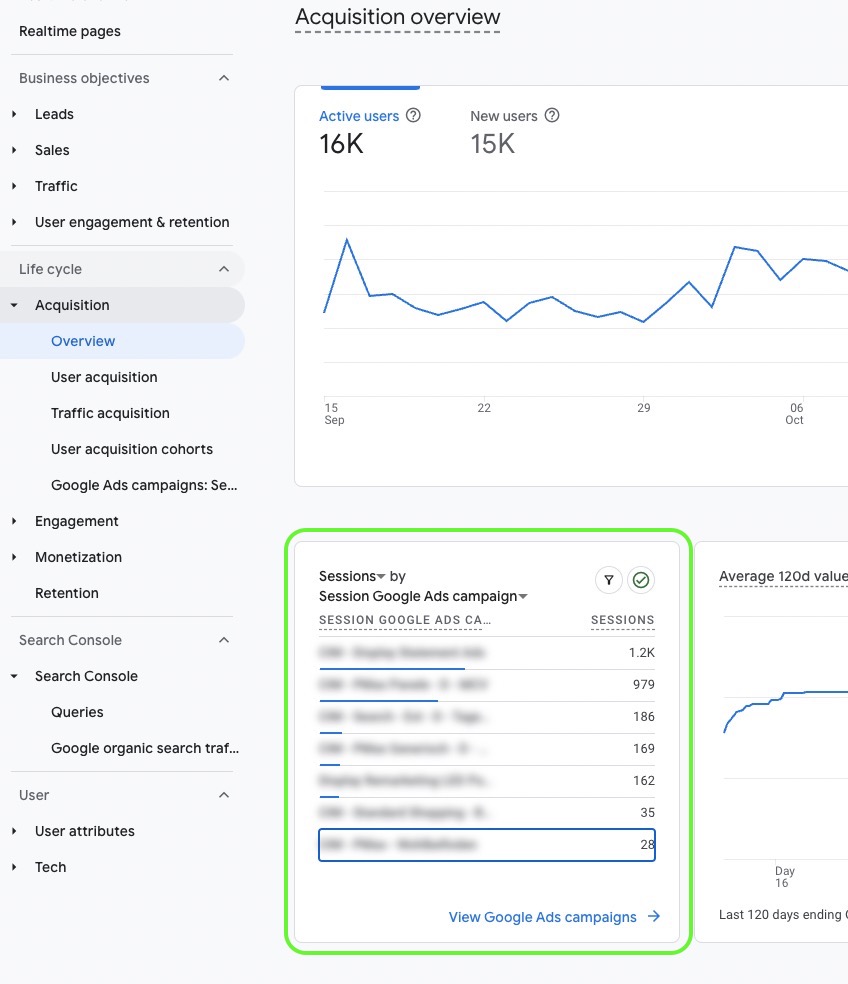
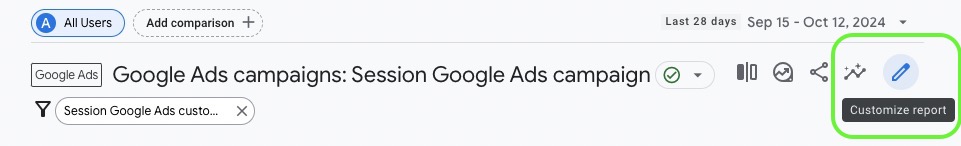
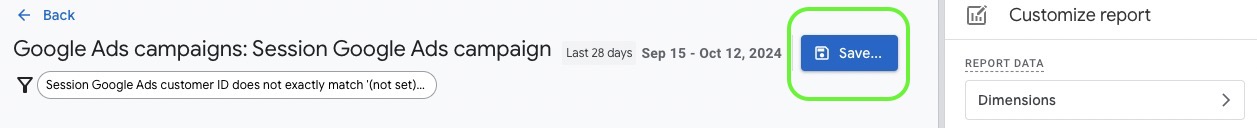
Customize report in the acquisition overview:
Open the Google Ads report, edit it to your liking and add it to the library.
OR
Create your own reports with “Exploration”:
Use the “Exploration” feature for custom reports. Note that these reports cannot be added to the library.
In the post, I will go into the individual points in more detail and give you step-by-step instructions for each. Here is the overview:
The first step is to link Google Ads with GA4. This allows you to ensure that all relevant campaign data is available in your GA4 property. Proceed as follows:
Open the admin area in GA4.
Go to Product links > Google Ads and link your Ads account.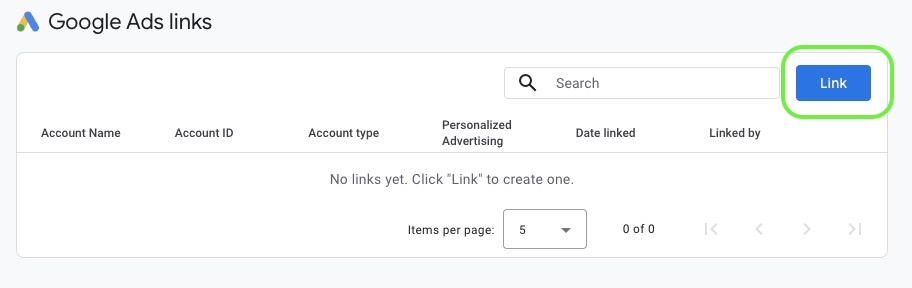
As soon as the connection is established, you will see dimensions such as campaign name, keyword text and search queries in GA4 reports.
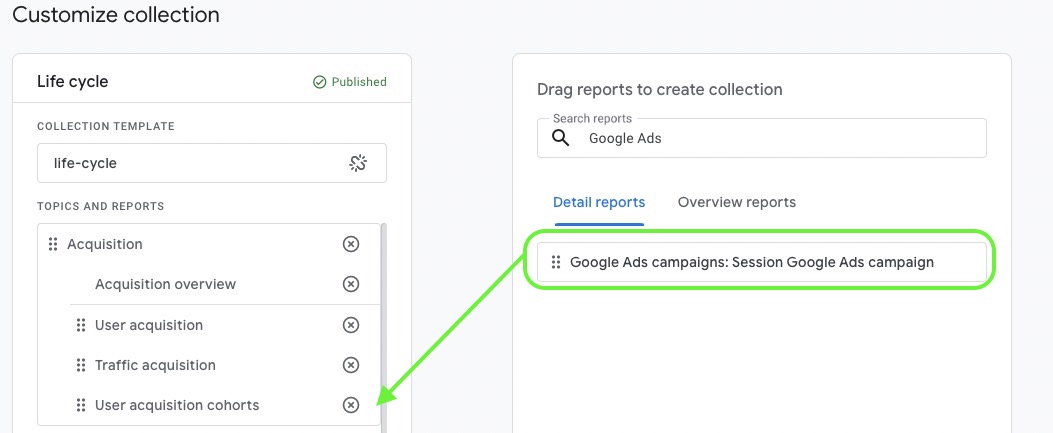
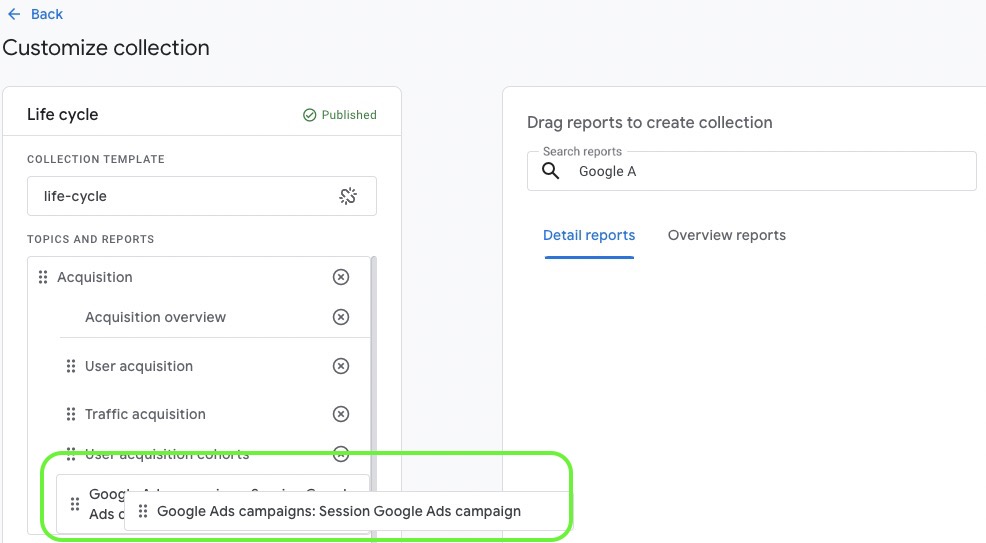
The GA4 library gives you the freedom to customize your reports and organize the sidebar individually. For example, you can customize the Google Ads report from the acquisition overview according to your needs and add it directly to the main navigation. This is how you proceed:
In GA4, as an administrator or editor, you can create and customize your own report collections and add them to the left-hand navigation bar. You can create up to 7 collections for each property and completely customize the arrangement of the reports within these collections.
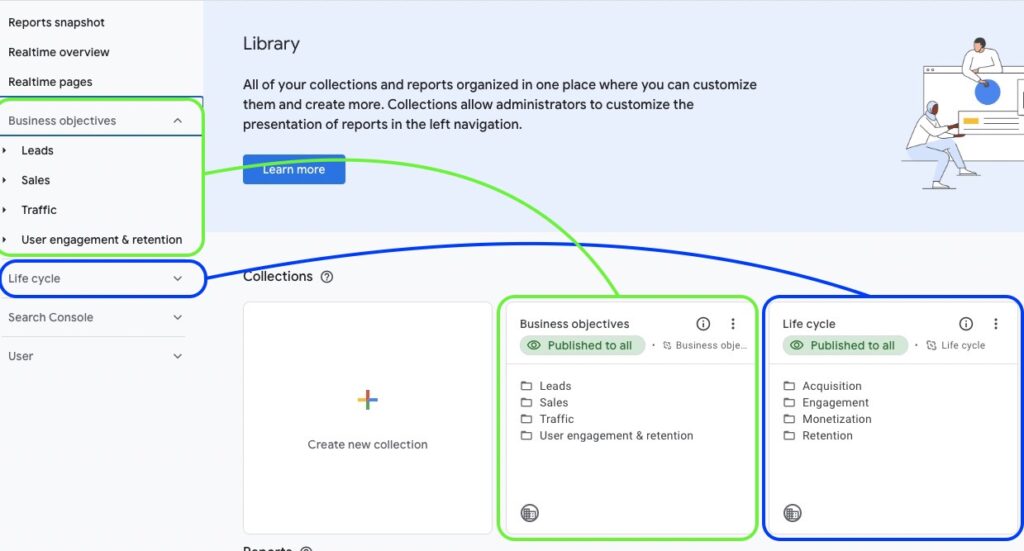


To make a collection available to all users of your GA4 property, you need to publish it:
The order of the collections in the navigation is alphabetical and you cannot change it manually. However, you can add, move or remove reports at any time.
Tip: With alphabetical sorting, you can easily control the order by naming. For example, use “01 – Life Cycle” and “02 – Acquisition”.
Google Analytics offers a variety of templates that you can use as a starting point:
Once you have selected a template, you can edit, move or delete reports to customize them to your needs.
For more information, check out this post from Google Analytics Support.
The explore feature in GA4 allows you to create custom reports to analyze Google Ads data in more depth. Here is a step-by-step guide on how to create a Google Ads report in GA4 exploration.
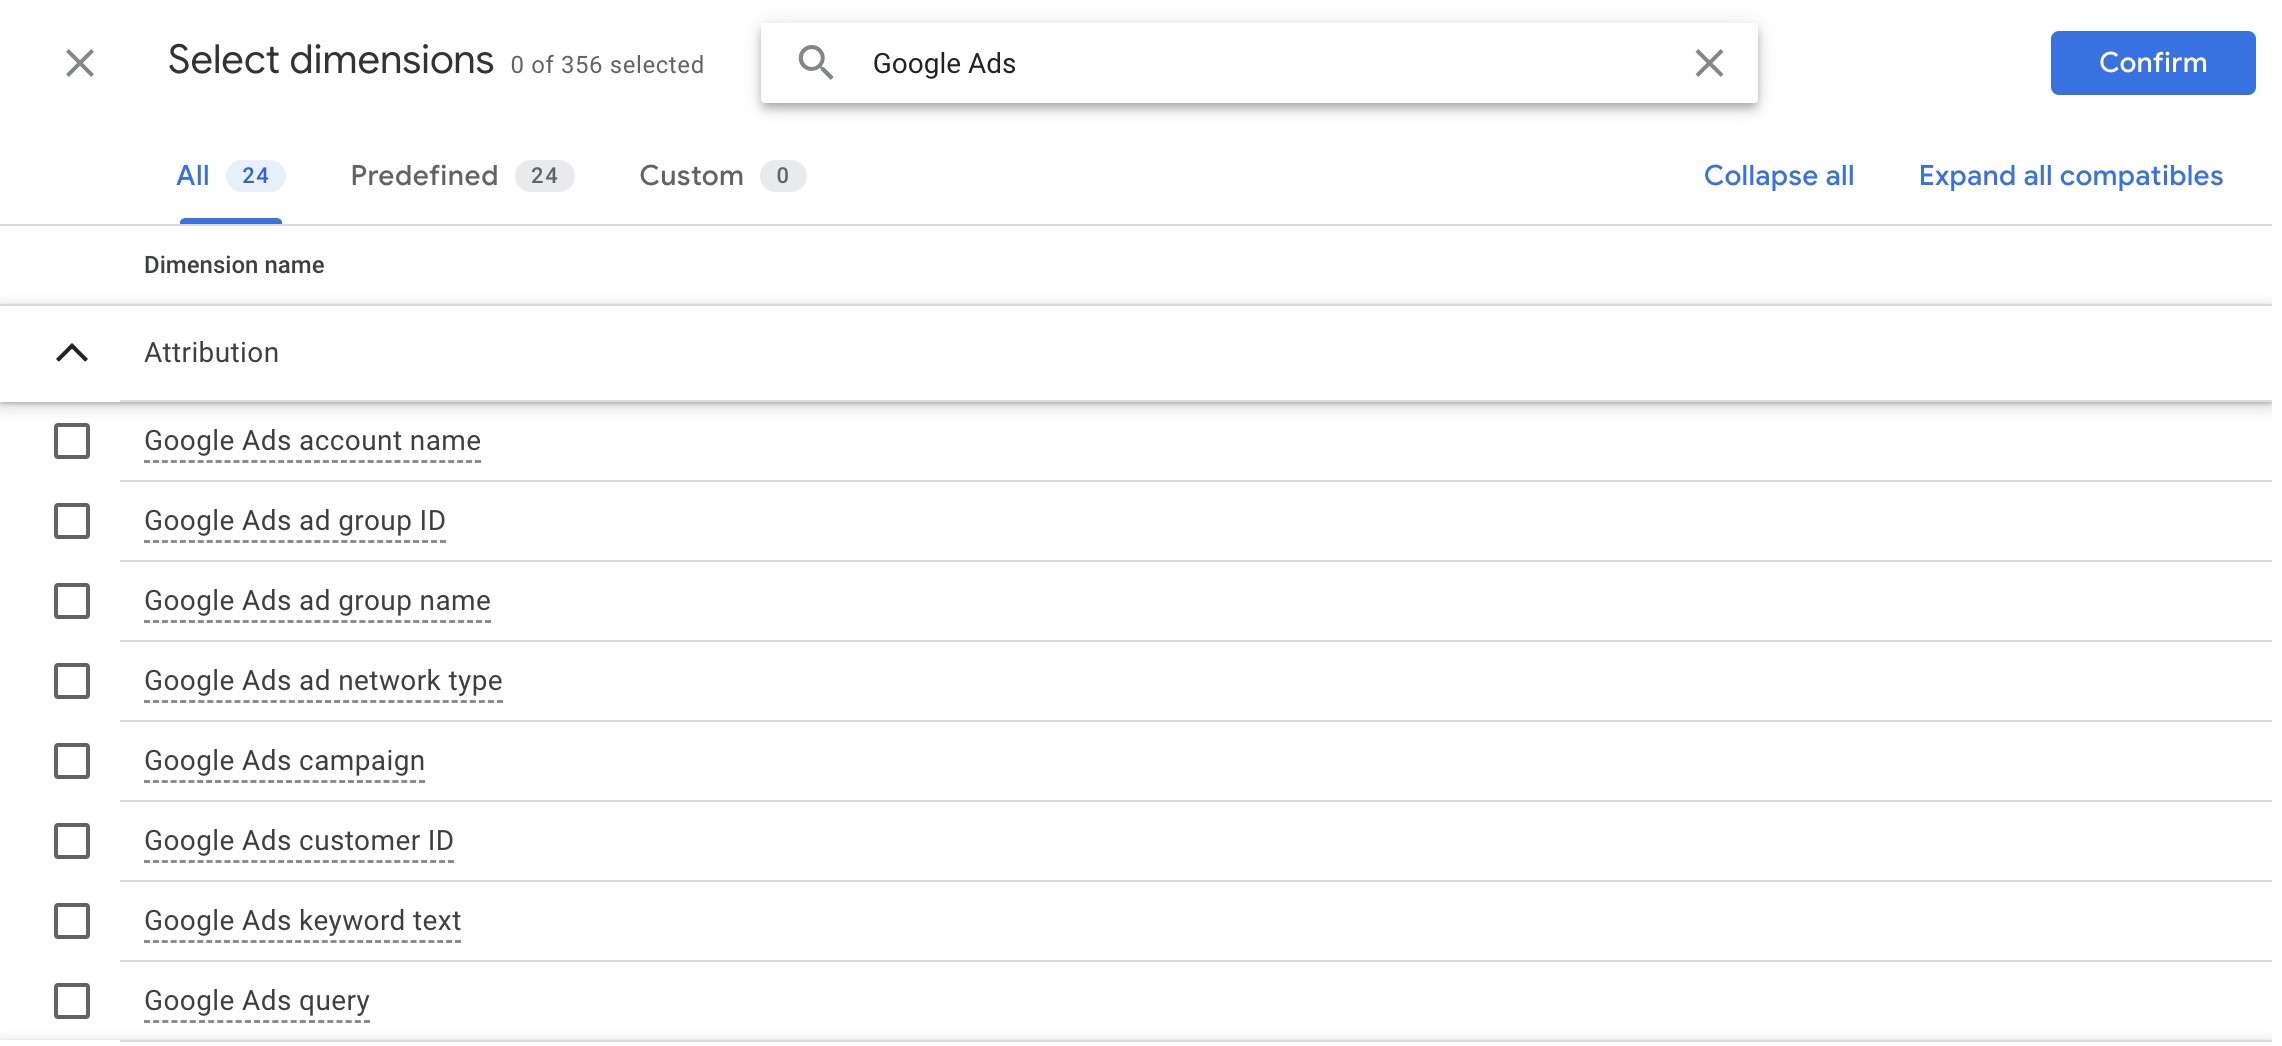
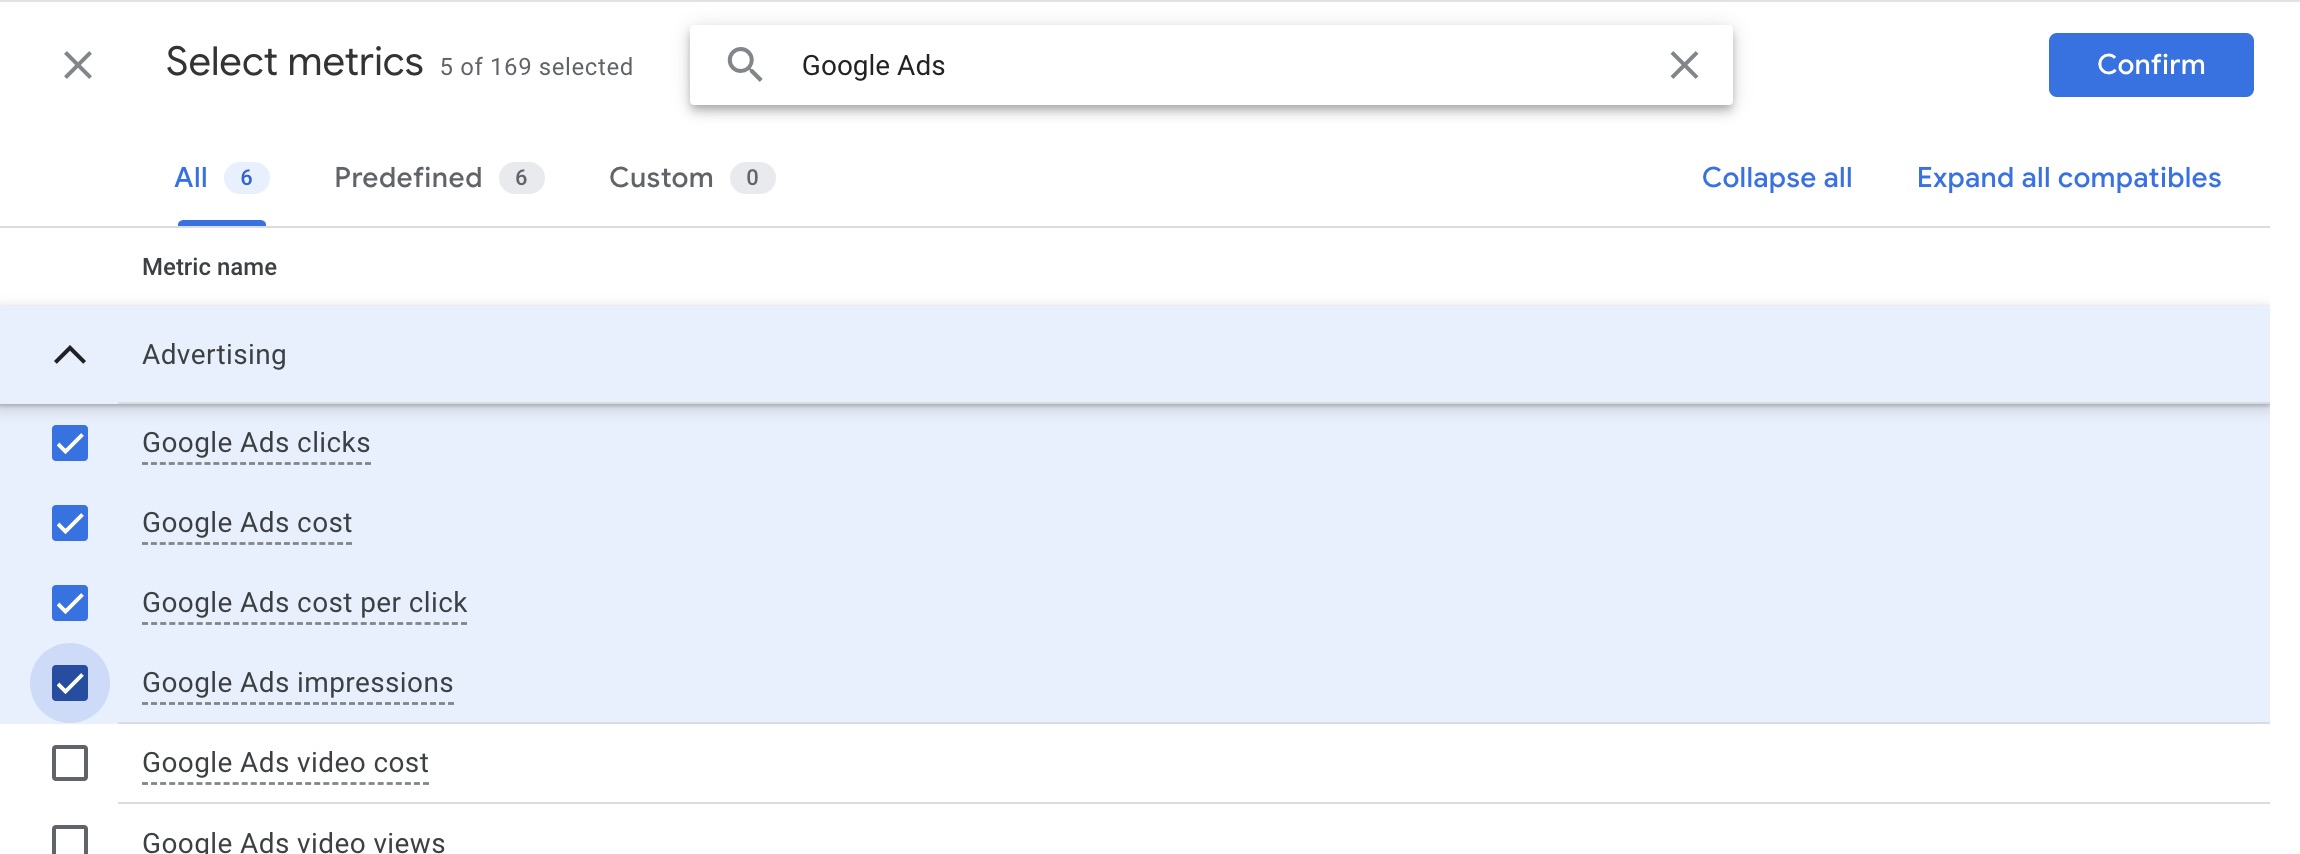


If you link Google Ads directly to GA4, you gain access to special Google Ads dimensions such as campaign name, ad group name and keyword text. These are automatically transferred to GA4 and allow you to analyze the performance of your ads in detail. You also have access to Google Ads-specific metrics, including clicks, costs and conversions. This allows you to assess the efficiency of your campaigns much more precisely.
In contrast, the use of UTM parameters captures more general dimensions such as source, medium, campaign, keyword, etc. UTM parameters are particularly useful if you want to compare traffic across different sources, as they can be used as a universal tagging method.
Auto-tagging in Google Ads automatically fills in the UTM parameters, which makes tracking easier. The downside to this is that you don’t get specific Google Ads metrics such as cost or clicks associated with this traffic. Therefore, linking Google Ads and GA4 directly is the better approach if you want to analyze the performance of your Google Ads campaigns in detail.
One of the biggest challenges when analyzing Google Ads data in GA4 is the influence of privacy measures such as cookie banners, Google Consent Mode and ad blockers. These factors mean that the number of clicks in Google Ads is always higher than the corresponding sessions recorded in GA4. There are the following reasons for this:
To understand how reliable your data is, you should know your opt-in rates of the cookie banner. The higher the approval rate, the better the data you can analyze in GA4.
GA4 is well suited to tracking trends and relative developments. However, absolute figures, such as clicks and conversions, are less precise. If you understand these discrepancies, you can still gain valuable insights into the performance of your campaigns and make meaningful optimizations.
Check the integration in the administrator settings under “Product links”. Test whether Google Ads data such as campaign names or clicks are displayed in GA4.
No, GA4 uses a different data structure. It is recommended to manually recreate reports in GA4 to adapt them to the new features.
Key metrics include conversions (or key events), cost per conversion, engagement rate and average session length.
You can configure reports to update regularly by defining default time periods and adjusting the reporting accordingly.
Yes, you can link multiple Google Ads accounts to a GA4 property by repeating the product link for each account.
GA4 may seem complicated at first glance, but it can be easily customized to your needs – and this also applies to Google Ads reports. Once you know how to create and customize reports, the process is done quickly. This flexibility gives you deeper and more detailed insights into your campaign data.
However, always be aware of the impact of data protection measures that can affect data quality. Use GA4 primarily to analyze trends and developments in order to make informed decisions for your campaigns.
I hope I have been able to help you and wish you every success with Google Ads!
Work smart with Clicks in Mind

Hi, my name is Thimo Hofner. I have been working in online marketing as a Google Ads Manager for more than 5 years. Through many courses, trainings and most importantly working with many different clients, I have learned the best strategies for success with Google Ads. On my blog and YouTube, I share my knowledge to help you drive more success with online marketing.
Driving Your Success Through Smart Online Marketing.
As a reliable partner, I can help your company generate more customers and sales with Google Ads. After more than 5 years as a Google Ads Manager and more than $1.2 million in managed advertising budgets, I can quickly recognize where you need to make adjustments to get more out of your budget.

© 2026 Clicks in Mind